
The charts below give information about USA marriage and divorce rates between 1970 and 2000 and the marital status of adult America in two of the years. Summarise the information by selecting and reporting the main features, and make comparisons where relevant.
TOEFL, IELTS, Personal Statement and CV Proofreading Services. › IELTS Writing › The charts below give information about USA marriage and divorce rates between 1970 and 2000 and the marital status of adult America in two of the years. Summarise the information by selecting and reporting the main features, and make comparisons where relevant.
-
May 27, 2021 at 9:40 am
The charts below give information about USA marriage and divorce rates between 1970 and 2000 and the marital status of adult America in two of the years. Summarise the information by selecting and reporting the main features, and make comparisons where relevant.
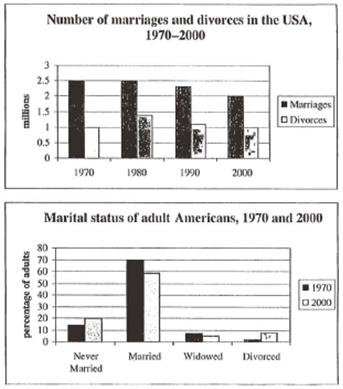
The bar graphs illustrate the figures of residents get married and divorced in USA, and the marital condition in terms of four categories(never married, married, widowed, divorced)over last 30 years.
Overall,it is clear the see that the number of married couples rate are significant higher than divorced rate whenever in which year. The second graph shows more inhabitants are willing to get married in the years 1970 and 2000.
As the first bar chart shows, people share the same marriage rates(2.5 millions) between 1970 and 1980. From 1990 onwards, the figures has declined from around 2.3 millions to 2 millions. With regards to divorce ratio, which is comparatively lower than married group.It nearly provides a negligible change which is around the number of 1 million in other three years except 1980, the number of divorced couple peaked at 1.4 millions or so in 1980.
According to the second graph, the percentage of adults who get married is 70% in 1970, which is by far the highest ratio as the figures be given,but it saw a 11% decrease over 30 years period. 15% and 20% adults are tend to be lived alone in the years 1970 and 2000 respectively.In 1970, approximately 8% of widowed adults were lost there partner, whereas the divorced couple are almost there-fold less than the widowed people.
Score: ungraded
Issues:
- About 75% of the sentences exceed 20 words. Simplify or split them. (TOEFL/IELTS: 15%- qualifies for non-software revision; 30% applies to GRE writing)
- About 65% of the sentences are passive; convert them into their active counterparts. (10%- qualifies for non-software TOEFL/IELTS/GRE writing revision );
- Extensive grammatical errors.
I will send you screenshots to illustrate specific problems/errors.
June 6, 2021 at 2:42 amThe bar graphs illustrate the figures of residents getting married and divorced in the US, and the marital situation through four categories(never married, married, widowed, divorced) over the last 30 years.
Overall, it is clear to see that the number of married couples is significantly higher than the divorce rate whenever in which year. The second graph shows more inhabitants were willing to get married in the years 1970 and 2000.
As the first bar chart shows, people shared the same marriage rates(2.5 million) between 1970 and 1980. From 1990 onwards, the figures have declined from around 2.3 million to 2 million. With regards to the divorce ratio, which is comparatively lower than the married group. It nearly provides a negligible change around the number of 1 million in other three years except 1980, the number of divorced couples peaked at 1.4 million or so in 1980.
According to the second graph, the percentage of adults who got married was 70% in 1970, which is by far the highest ratio as the figures were given, but it saw a 11% decrease over 30 years period. 15% and 20% of adults tend to live alone in the years 1970 and 2000 respectively. In 1970, approximately 8% of widowed adults lost their partner, whereas the divorced couple are almost there-fold less than the widowed people.
The bar graphs illustrate the figures of (delete) residents getting married and divorced in the US, and the marital situation (word choice error) through four categories (never married, married, widowed, divorced) over the last 30 years. (this paragraph does not add much)
Overall, it is clear to see (delete) that the number of married couples is significantly higher than the divorce rate whenever in which year (rephrase/simplify). The second graph shows more inhabitants (choose a better word) were willing to get married in the years 1970 and 2000.
As the first bar chart shows, people shared the same marriage rates (rephrase, people do not have or “share” a “marriage rate”) (2.5 million) between 1970 and 1980. From 1990 onwards, the figures (which figures) have declined from around 2.3 million to 2 million. With regards to the divorce ratio, which is comparatively lower than the married group (rephrase, this is also an incomplete sentence). It (slightly unclear what this pronoun refers to) nearly provides (word choice error) a negligible change around the number of 1 million in other three years except 1980, the number of divorced couples peaked at 1.4 million or so in 1980 (rephrase this part, can be simplified to increase clarity).
According to the second graph, the percentage of adults who got married (can slightly simplify) was 70% in 1970, which is by far the highest ratio as (of) the figures were (delete) given, but it saw an 11% decrease over 30 years period (over a 30-year periord). 15% and 20% of adults tend to live alone in the years 1970 and 2000 respectively (reword). In 1970, approximately 8% of widowed adults lost their partner, whereas the (delete) divorced couples are almost there-fold (spelling error) less than the (delete) widowed people.
You must be logged in to reply to this topic.