
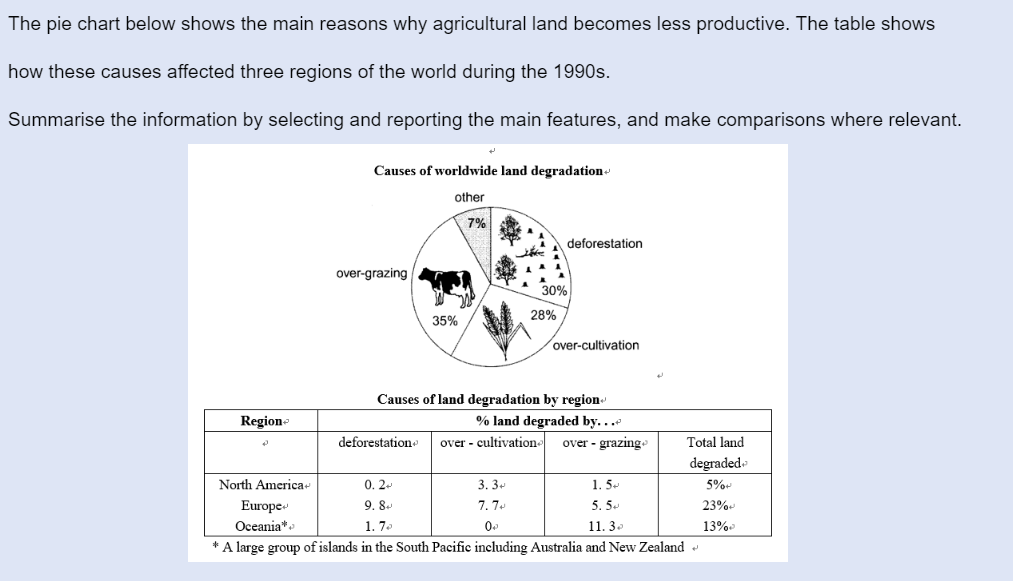
The pie chart below shows the main reasons why agricultural land becomes less productive. The table shows how these causes affected three regions of the world during the 1990s.
TOEFL, IELTS, Personal Statement and CV Proofreading Services. › IELTS Writing › The pie chart below shows the main reasons why agricultural land becomes less productive. The table shows how these causes affected three regions of the world during the 1990s.
-
September 13, 2020 at 2:35 pm
The pie chart below shows the main reasons why agricultural land becomes less productive. The table shows how these causes affected three regions of the world during the 1990s.
<i>Summarize</i> the information by selecting and reporting the main features, and make comparisons where relevant.
The pie chart demonstrates what have contributed to less productive agricultural land all over the world, while the table illustrates land deterioration status in North America, Europe and Oceania during the 1990s. By and large, the main cause of worldwide land degradation is over-grazing, while the region whose land had deteriorated the most in 1990s was Europe.
Several causes attribute to land degradation. Over-grazing, as the most severe problem, take part in 35 percent of all causes. While deforestation maintains a proportion of three tenth among all causes, over-cultivation is just approaching its figure. Nevertheless, there are also 7% other reasons which failed to give their names.
When it comes to specific regions in 1990s, North America had preserved its land most successfully, with 3.3% of land degraded by over-cultivation, and 1.5% by over-grazing, 0.2% by deforestation. Europe, as the region which suffered most from degradation, had hold a proportion of 9.8%, 7.7%, 5.5%, of land degraded by deforestation, over-cultivation and over-grazing, respectively. Oceania is slightly different though, with none of their land being over-cultivated, but over one tenth of their land had degraded by over-grazing. Overall, only 5% of land in North America had degraded, but 23% of land had degraded in Europe, and 13% of land suffered from degradation in Oceania.
September 17, 2020 at 1:26 amThe pie chart demonstrates what makes farm land less productive, while the table compares how these reasons contributed to land deterioration in North America, Europe and Oceania in 1990s.
To summary, over-grazing caused the most land degradation, though the other two reasons hold a similar proportion. The region whose land had deteriorated the most by 1990s was Europe.
According to the pie chart, over-grazing, the most severe problem, takes part in over one third of all causes. The other two reasons, deforestation and over-farming, hold similar percentages at approximately three tenth.
When it comes to specific regions in 1990s, all the regions succeeded in preserving more than one fourth of their land. However, Europe, as the region which suffered most from overexploitation, had almost one tenth of its land deteriorated by deforestation. In North America, where only 5% of its land degraded, over half of all the land deteriorated by unsustainable farming. Oceania is slightly different from the other regions though, with over one tenth of its land degraded by over-grazing, while no land was spoiled by farming excessively.
Invalid [ please complete the revision of your first essay prior to submitting a new one.]
You must be logged in to reply to this topic.